

TWR vs MWR: Understanding Your Portfolio Returns
Time-weighted and money-weighted returns answer different questions. A worked example, how Wealthfolio calculates TWR and XIRR, and what to check when the numbers disagree.
Your portfolio balance combines the money you put in with what happened to it while it was invested. A larger balance can come from investment gains, new contributions, or both. The balance alone doesn’t tell you how the investments performed.
Return percentages help separate those effects. But once you add or withdraw money over time, there are two useful questions: how did the portfolio perform, and what return did the money you invested actually earn?
Wealthfolio calculates time-weighted return (TWR) and money-weighted return (MWR) for transaction-tracked accounts. They answer those questions from the same history. This post explains how to read them, why they can disagree, and how currency movements can affect both.
Two questions behind one percentage
Time-weighted return (TWR) asks how the portfolio performed after adjusting for money entering and leaving it. A deposit increases your balance, but it isn’t an investment gain. A withdrawal reduces your balance, but it isn’t an investment loss. TWR adjusts for those flows and links the returns across the period.
Money-weighted return (MWR) asks what return fits the money you invested, when you invested it, what you took out, and what remained at the end. A loss while you had $10,000 invested carries more weight than a gain while you had $1,000 invested.
| Measure | Question it helps answer | Effect of contributions and withdrawals |
|---|---|---|
| TWR | How did the portfolio perform over this period? | Adjusts for external cash flows |
| MWR | What return did my invested money earn over this period? | Includes their amounts and dates |
The distinction is about cash flows, not a verdict on whether you are a good investor. Contributions can follow a salary, an inheritance, or an expense you needed to pay. MWR reflects that history without explaining why it happened.
A gain in percent, a loss in dollars
Take a fictional portfolio with one investment. Ignore fees, dividends, and currency changes. All the money stays invested, and the price doesn’t change while the July contribution is made.
| Date | What happens | Portfolio value |
|---|---|---|
| January 1, 2025 | You begin with $1,000 invested | $1,000 |
| July 1, 2025 | The investment has gained 20% | $1,200 |
| July 1, 2025 | You add and invest another $9,000 | $10,200 |
| January 1, 2026 | The investment has fallen 10% since July | $9,180 |
The time-weighted return links the two moves:
(1 + 20%) × (1 − 10%) − 1 = +8%But you put in $10,000 and finished with $9,180. You lost $820.
The first gain earned $200. The later loss cost $1,020, because much more money was invested by then. For those dates and cash flows, Wealthfolio’s XIRR calculation gives an annualized MWR of approximately −14.4%. Its selected-period MWR also rounds to −14.4% for this one-year window.
TWR describes the investment’s path through the year. MWR includes how much of your money experienced each part of that path. The dollar result tells you the amount gained or lost. None of these numbers replaces the others.
How Wealthfolio calculates them
Both calculations start with the selected scope’s daily valuations and external cash flows. They then take different paths.
For TWR, Wealthfolio calculates a return between each pair of daily valuations. It treats inflows as available at the start of the day and outflows as leaving at the end:
Daily return = (Closing value + Outflows − Opening value − Inflows)
               / (Opening value + Inflows)
It compounds those daily returns to get the return for the whole period. This is a daily calculation; it doesn’t reconstruct a separate valuation at the exact time of every intraday deposit or withdrawal.
For MWR, Wealthfolio uses a dated internal-rate-of-return calculation, usually called XIRR. The opening portfolio value and subsequent contributions are money invested. Withdrawals and the closing portfolio value are money received back. The solver finds an annual rate that balances that series after accounting for the dates. It uses a 365.25-day year, then converts the annual rate back to a return for the selected period.
That is a single calculation over the period, rather than a chain of daily money-weighted returns. The GIPS explanation of money-weighted returns sets out the same distinction between a period-wide IRR and linked sub-period returns.
Period and annualized returns need different labels. A 21% return over two years is equivalent to a 10% compounded annual rate. Wealthfolio keeps both forms available. On transaction-tracked account detail pages, the TWR and IRR cards show annualized values for windows of at least 365 days when available; hovering the value shows the corresponding period return. Shorter windows show period returns.
The boundary matters
A cash flow is external to the accounts you are measuring.
Move money from one tracked account to another. Viewed from the first account, it leaves. Viewed from the second, it arrives. When both accounts are included in the same scope and the transfer is correctly paired, it stays inside that scope. It shouldn’t become a new contribution to the combined portfolio.
Buying a security is also different from adding money. You exchange cash for an investment already inside the account. Selling reverses that exchange. Dividends and interest are investment income, not fresh contributions from outside. Those distinctions let the calculation separate investment results from money crossing the boundary.
This is why the scope matters as much as the date range. A single account and a group of accounts can have different cash-flow histories even when they hold some of the same investments.
Currency is part of the return
The currency you measure in can change the result, even when the investment’s own price is rising. TWR adjusts for external cash flows; it doesn’t remove foreign exchange (FX) effects. MWR also reflects the values and cash flows in the currency used for the calculation.
For a simple example, suppose an investment rises from US$100 to US$110. Over the same period, the exchange rate falls from C$1.40 to C$1.25 per US$1. Ignore contributions, fees, and income:
| Measure | At the start | At the end | Change |
|---|---|---|---|
| Value in USD | US$100 | US$110 | +10% |
| Value in CAD | C$140 | C$137.50 | Approximately −1.8% |
The investment gained in USD, but the weaker US dollar more than offset that gain when measured in CAD. Currency movements can also work in the other direction and increase the return.
Wealthfolio calculates account and portfolio performance from daily valuations and cash flows in your base currency. FX movements are already part of those values and therefore part of the resulting TWR and MWR. A USD account can have a different return measured in CAD from the return measured in USD. Changing the return formula doesn’t remove that currency exposure.
The Performance page’s gain/loss breakdown also includes an FX effect row. It helps explain the dollar result; it isn’t a separate FX-free return percentage. When comparing with a broker or benchmark, check the currency as well as the dates and return method. A symbol’s price-return series can use a different currency from your portfolio.
Where to read the numbers
For transaction-tracked accounts, Wealthfolio’s dashboard and account summary percentages use TWR. The account detail page also shows IRR, the app’s label for the money-weighted calculation, alongside TWR.
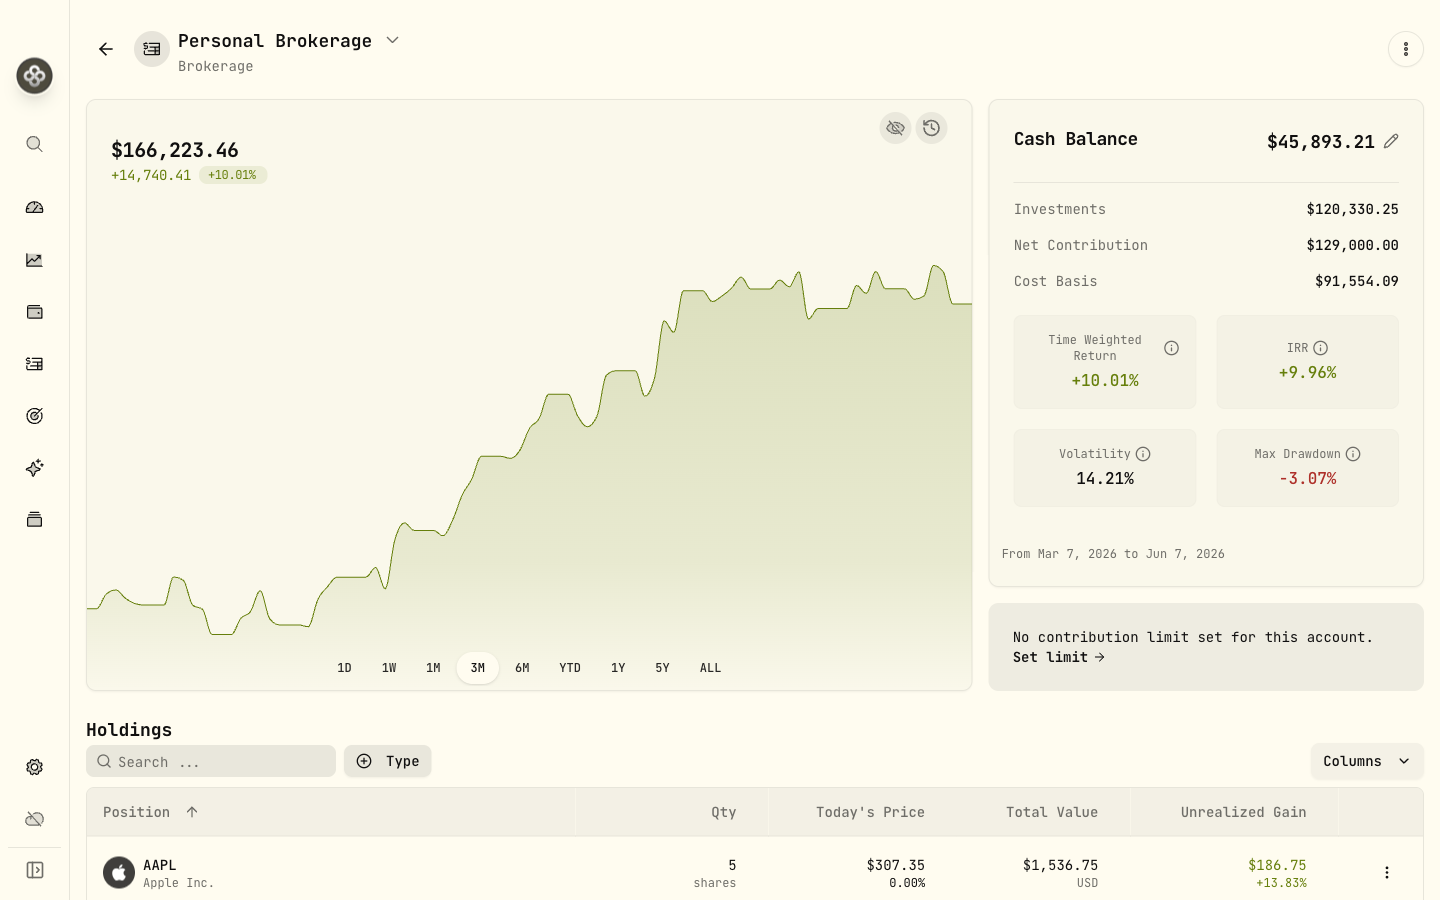
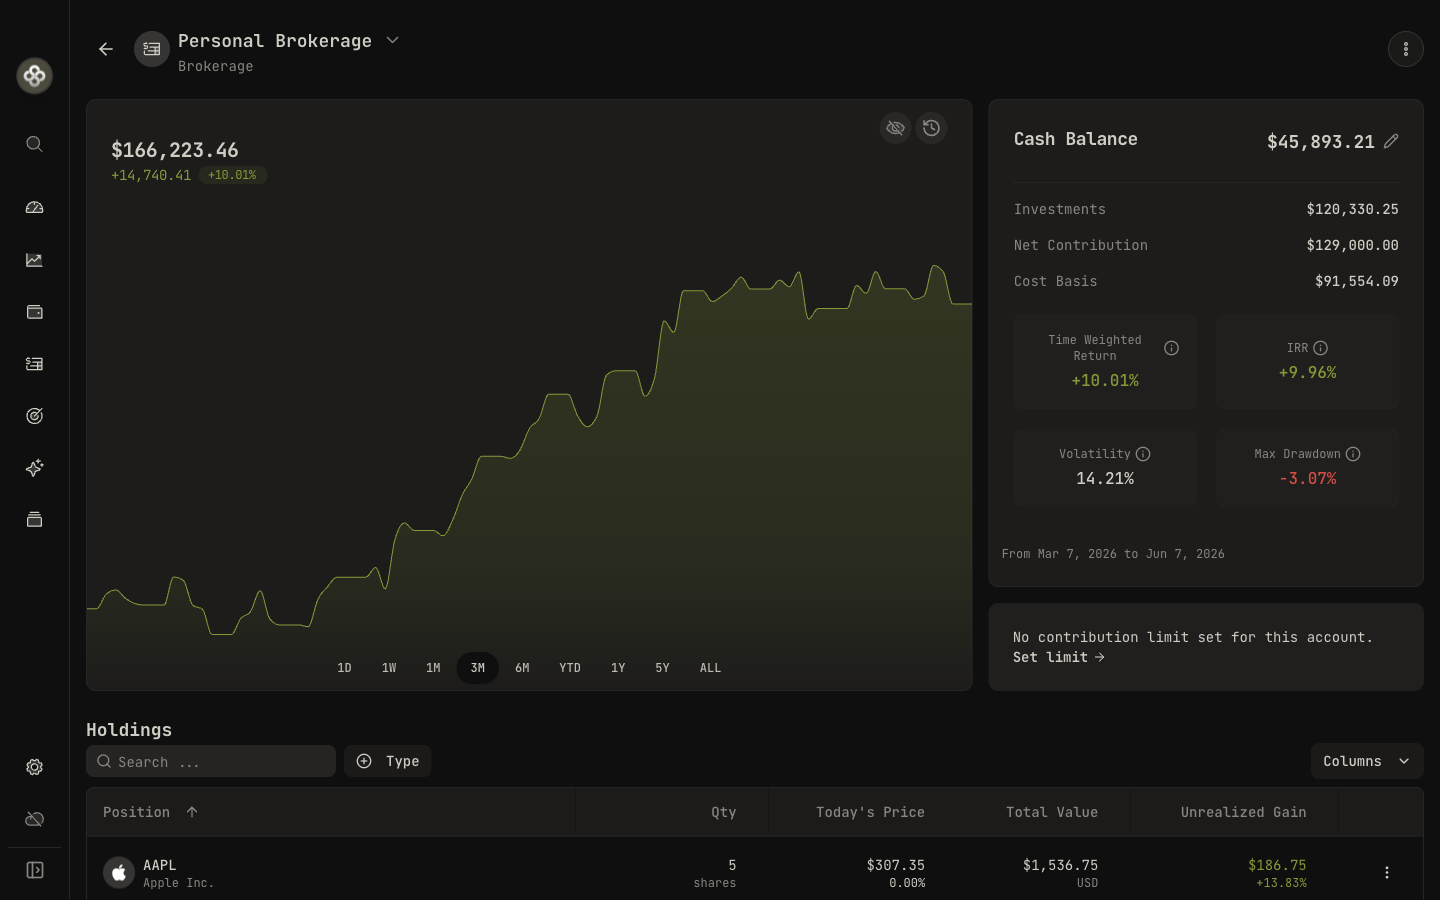
TWR and IRR on an account detail page. Both describe the selected account and date range.
Holdings mode has a different limit. Position and balance snapshots don’t provide a complete transaction cash-flow history. Wealthfolio reports Value Return for those accounts and leaves TWR and IRR unavailable. A scope mixing holdings-tracked and transaction-tracked accounts also uses Value Return. It should not be read as either TWR or MWR.
The Tracking Modes guide explains what each mode records and which calculations it supports.
Plot and compare on the Performance page
A final percentage tells you where the period ended. The Performance page shows the path: when returns rose, when they fell, and how they moved alongside other accounts or a benchmark.
Choose an account or portfolio and a date range. Use Add account to bring other accounts into the comparison, or Add Benchmark to add a reference symbol. For transaction-tracked scopes, the chart plots TWR. Hover over it to read returns at particular dates, and select an account or benchmark to see its metrics.
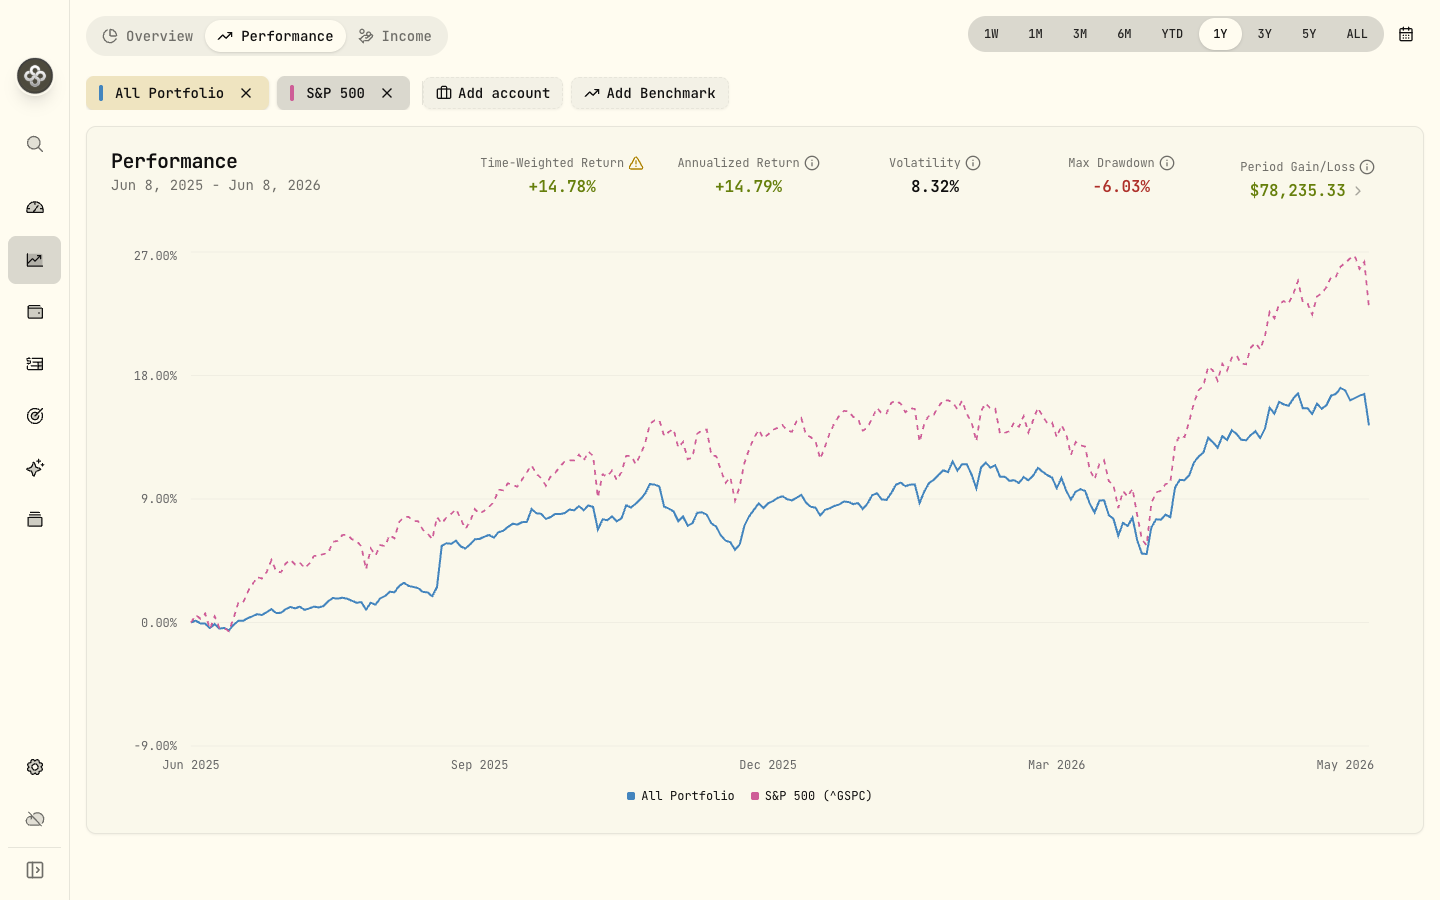
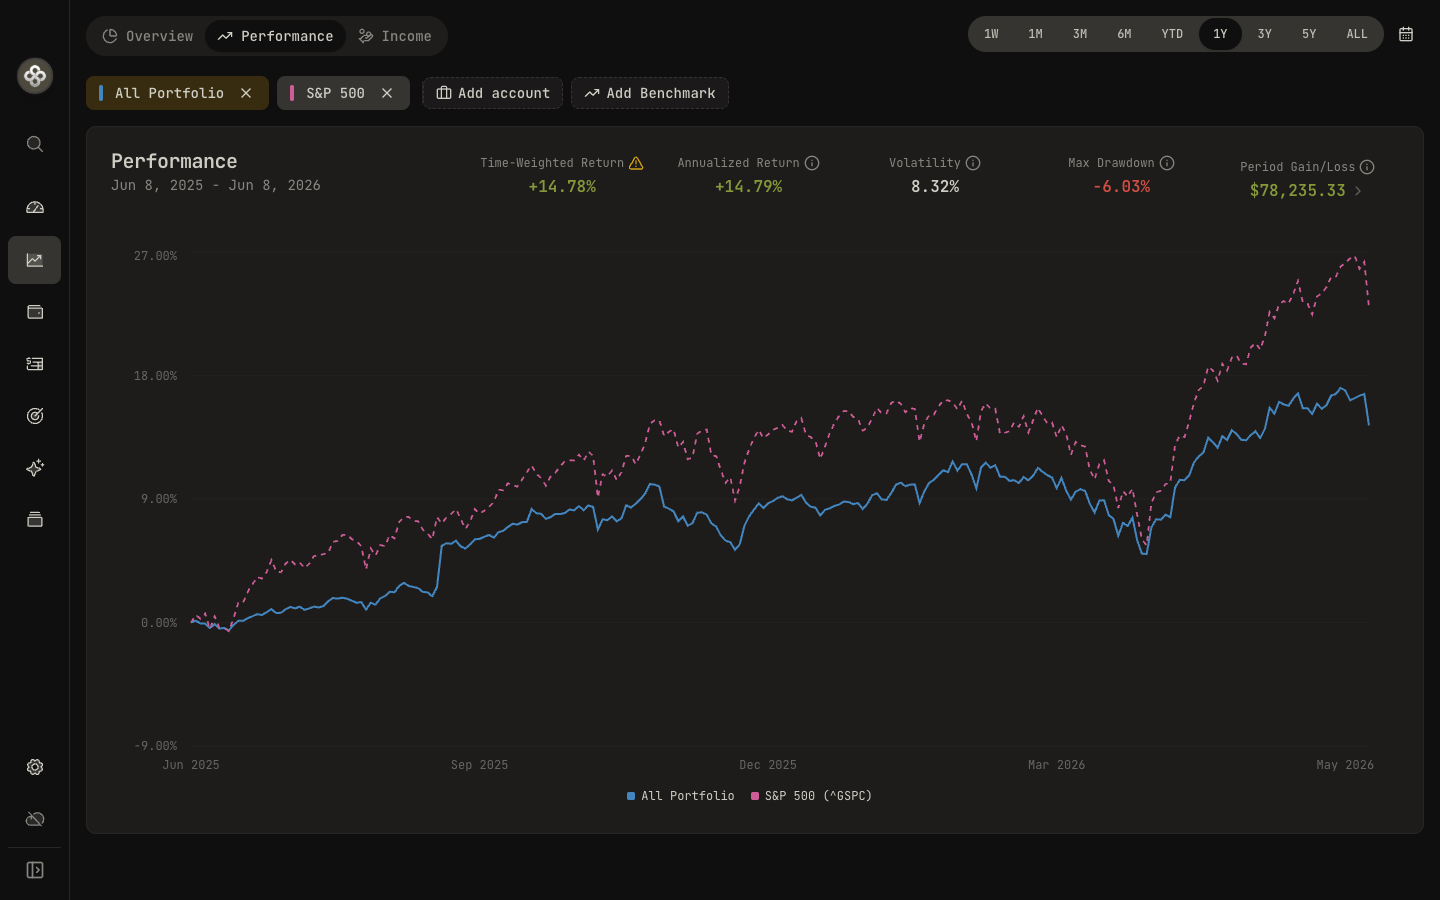
Portfolio TWR and a benchmark’s price-return series on the same chart.
MWR appears as a separate metric when available. Read it alongside TWR and the period gain or loss. You can also open the gain/loss breakdown to inspect investment income, realized and unrealized movements, fees, taxes, and the FX effect.
When the selected histories start on different dates, the chart compares their available common dates and gives the plotted lines the same starting point. Check that comparison window when reading it alongside a period summary.
A benchmark symbol uses price quotes. Wealthfolio doesn’t add dividends or distributions to that series; they are reflected only if the supplied quotes are already adjusted for total return. Check the income treatment and currency before comparing it with a portfolio that includes investment income.
Before treating a difference as an explanation
A gap between TWR and MWR can reflect when money arrived and left. It can also reflect incomplete records. The calculation only has the history you give it.
Start with the same dates, accounts, and currency. Then check deposits, withdrawals, and transfer pairs. A missing contribution can make incoming money look like growth. A transfer marked incorrectly can change the boundary the calculation uses. Currency movements can affect a return expressed in a different currency from the investments themselves.
Prices and valuations matter too. Wealthfolio can warn when some held positions are unpriced or when cash-flow amounts are uncertain. In some cases it calculates a partial result with a warning; in others the return is unavailable. A blank metric is different from zero.
There are also mathematical limits. TWR needs a usable opening value; the engine pauses compounding for tiny positive bases below one currency unit. XIRR needs both invested and returned amounts in its dated series, and the solver must find a rate. It can leave MWR unavailable when those conditions aren’t met.
When the records are complete, the two measures give you complementary views. Use TWR to compare performance without the size and timing of external flows changing the measure. Read MWR to understand the return on the money that was actually invested. Keep the dollar gain or loss beside them.
The Performance Metrics reference covers the formal definitions. In the app, start with one transaction-tracked account and one date range, then read TWR, IRR, and the dollar result together.