
Portfolio Dashboards
A tour of the home dashboard. What every card means and how to read it.
Last updated
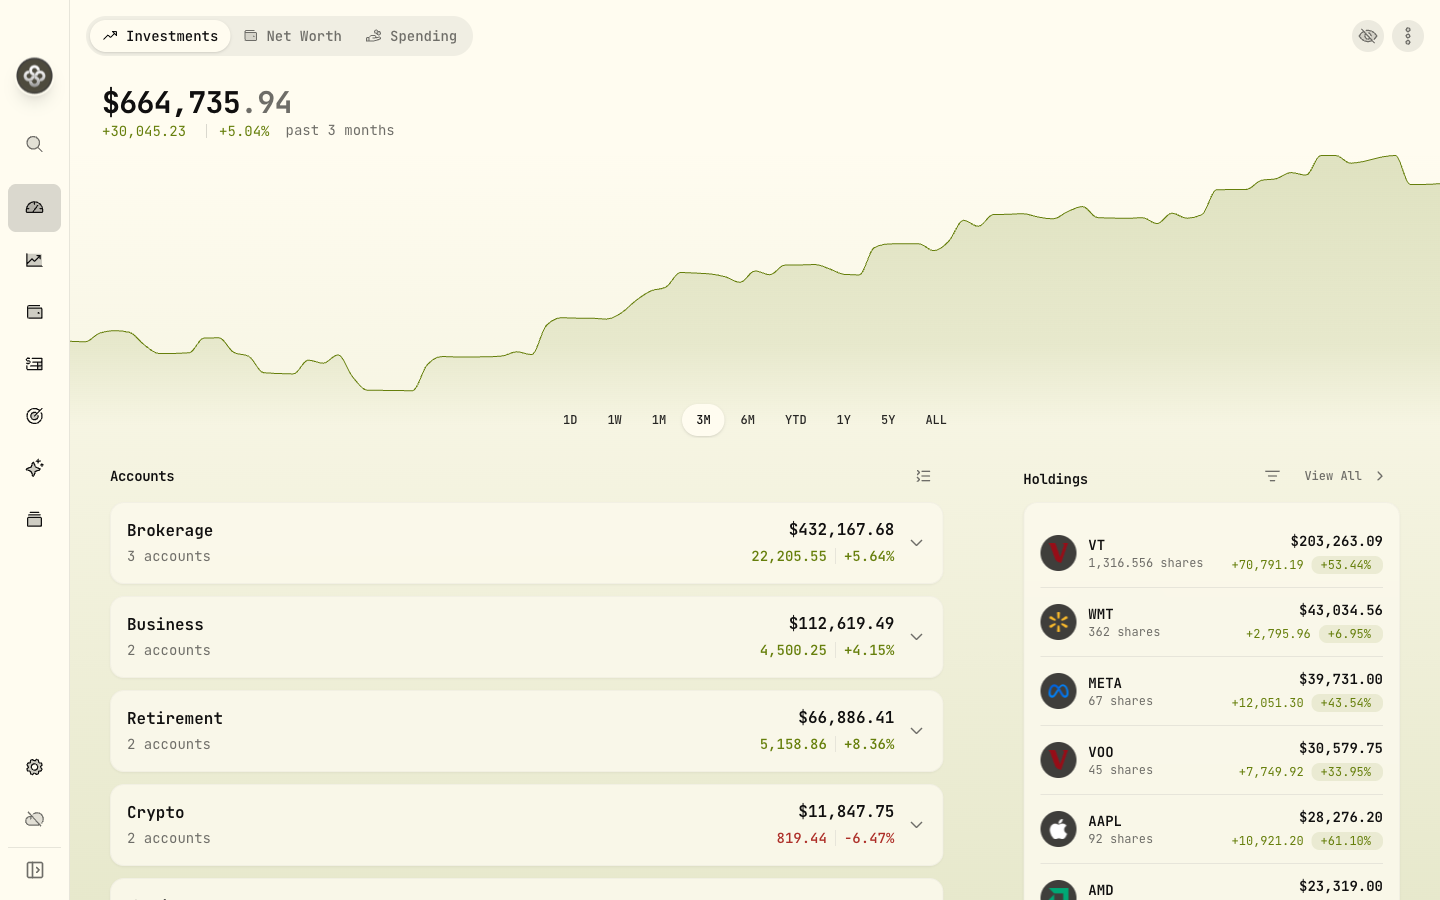
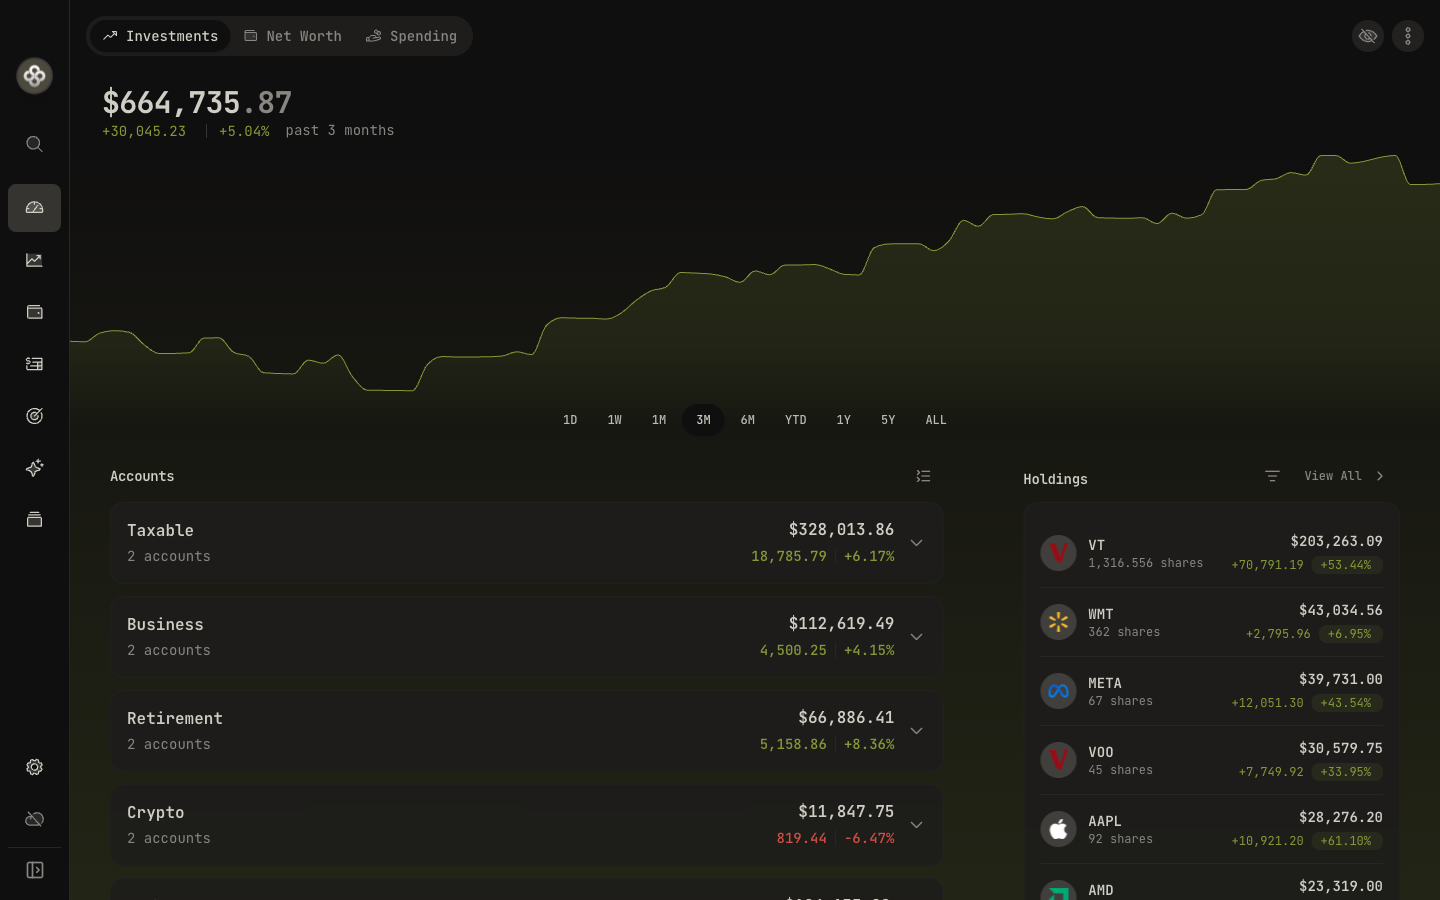
The home dashboard is the at-a-glance view of your portfolio. This page walks through each card so you know what you’re looking at, and where to dig in.
1 · The cards
Total Portfolio Value
The headline number. Sums all accounts converted to your base currency at today’s FX rate. Click the eye icon beside it to hide the value (handy for screenshots). The Net Worth and Spending tabs have the same button.
Below the headline are the gain and the return over the selected period, followed by the period.
Hover the change percentages for a tooltip explaining the metric (TWR vs. MWR; see Performance Metrics).
Accounts Summary
One row per account, with current value and the day’s change. Click any row to drill into that account’s holdings and activities.
Account groups (if you’ve set any up) roll up underneath their group name. Handy for “Spouse RRSP”, “Joint Taxable”, etc.
Top Holdings
The top 5–10 positions by current market value, with allocation percentage. Click any row to open the asset detail page (lots, price history, dividends).
To see every position, use the Holdings page from the sidebar.
Holdings page
The full position list, with a few controls worth knowing:
- Open / Closed — the view control before the search box. Open is the default and shows what you currently hold. Closed shows disposed positions with cost basis, sale proceeds, realized P&L, and realized return in place of the market-value columns (option expiries included). A closed position stays separate from an open one in the same asset, even when a long and a short net to zero.
- Type filter — stocks, ETFs, bonds, and cash, which carries its own portfolio weight on desktop and mobile.
- Quantity labels follow the instrument: shares for stocks, units for ETFs and mutual funds, bonds for debt securities, contracts for options.
- Search matches instrument name in both views, and sorting is preserved when you switch to a view that doesn’t have the column you sorted by.
For sector, region, and currency cuts, open Insights → Overview.
The mobile app carries the same controls. See the Mobile guide.
Asset Allocation
A donut chart broken down by asset class (Equity, Fixed Income, Cash, Crypto, Alternative). Hover any slice for the dollar value and percentage.
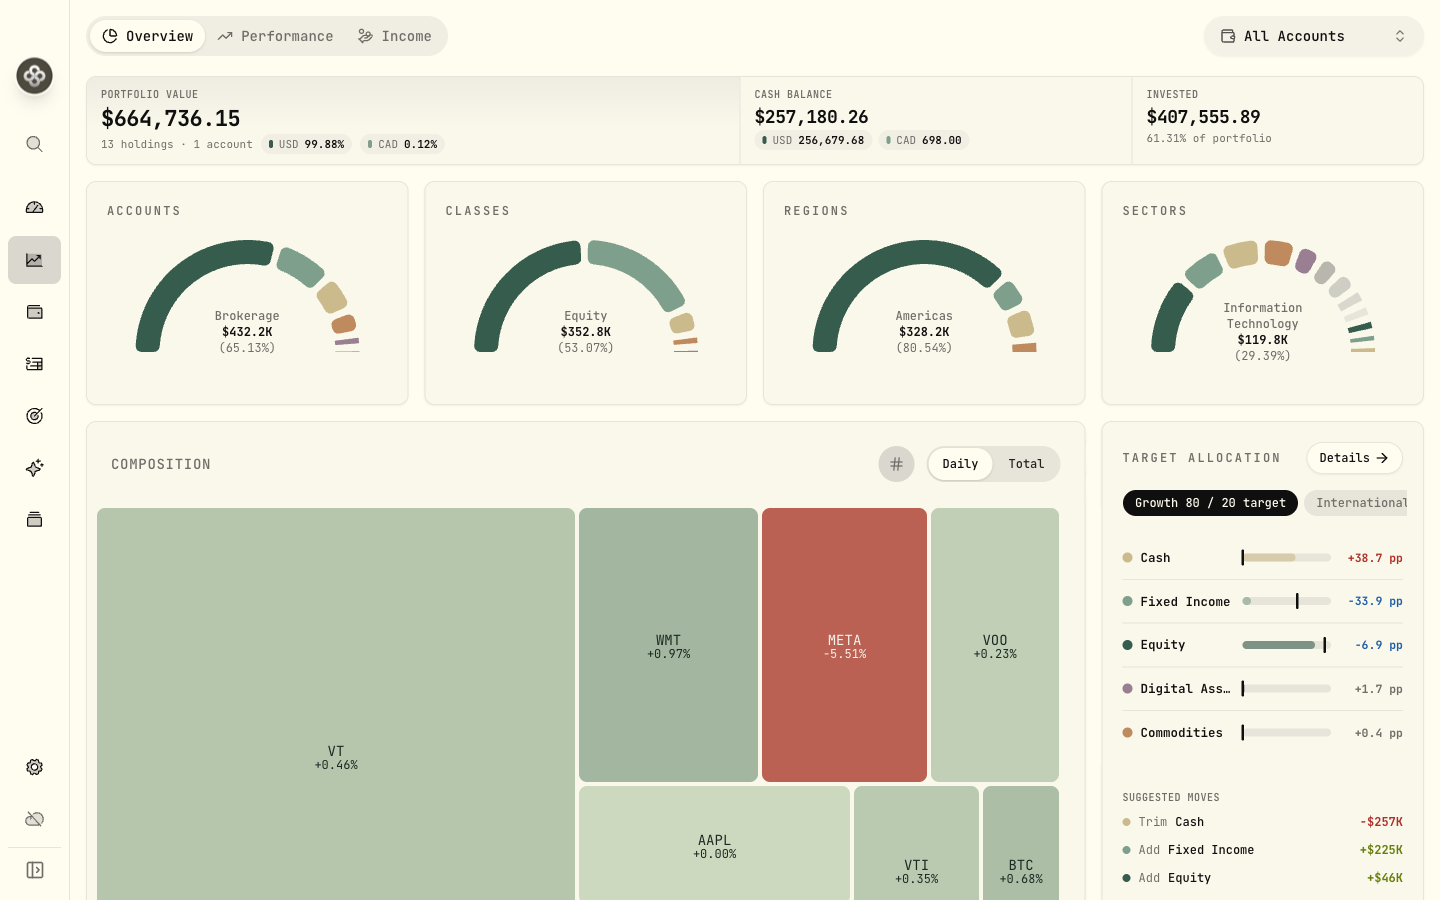
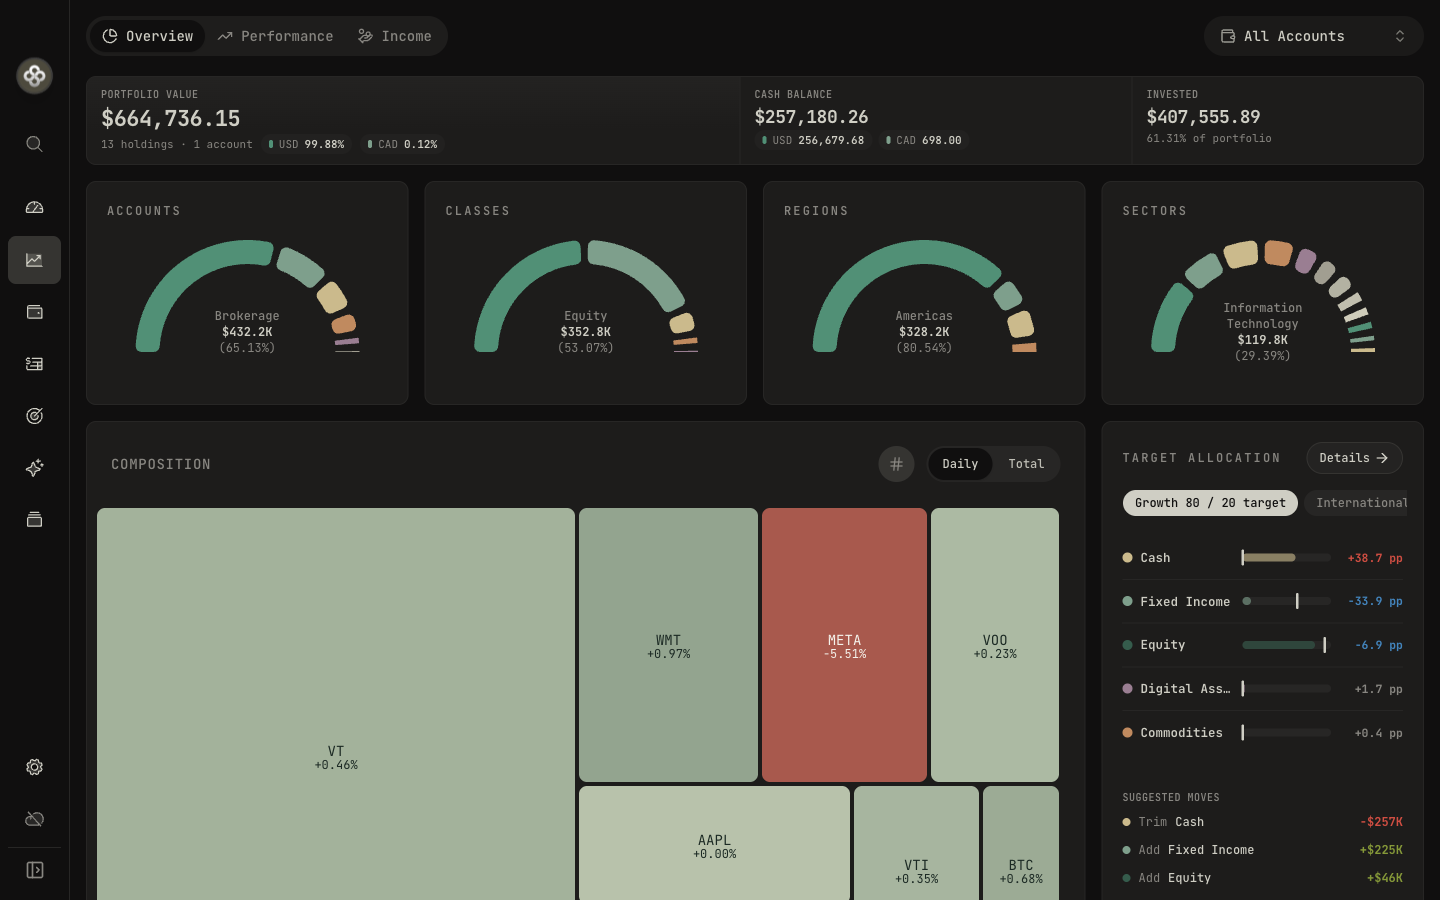
Drill further on Insights → Overview: its Accounts, Classes, Regions, and Sectors cards break the portfolio down, and its Breakdown card can also group it by currency.
Net Worth Chart
Historical net worth over time, with toggleable account inclusion. Useful for spotting trends and the impact of major contributions.
The chart follows the period buttons under it: 1D, 1W, 1M, 3M, 6M, YTD, 1Y, 5Y, and ALL. The calendar button beside them picks a single month or a custom range.
The dashboard’s Investments, Net Worth, and Spending tabs share one time period with the Spending and Performance tabs of Insights. Pick a period on any of them and the others follow, or show the nearest period they offer, so a single month or a custom range carries over too. Links that name a period still open on that period, and Insights’ Income tab keeps its own.
Net Worth dashboard
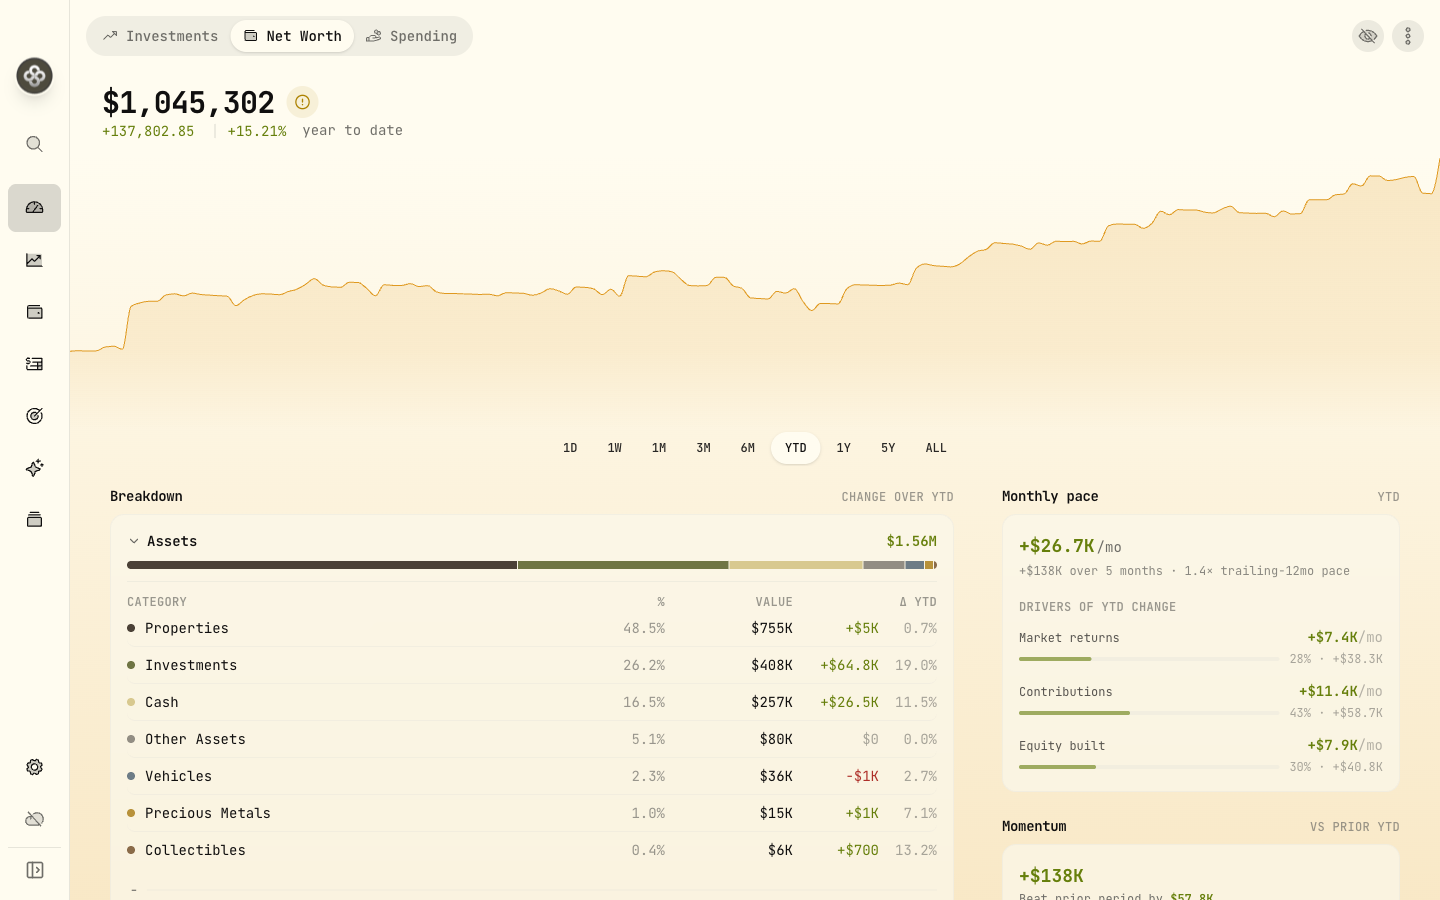
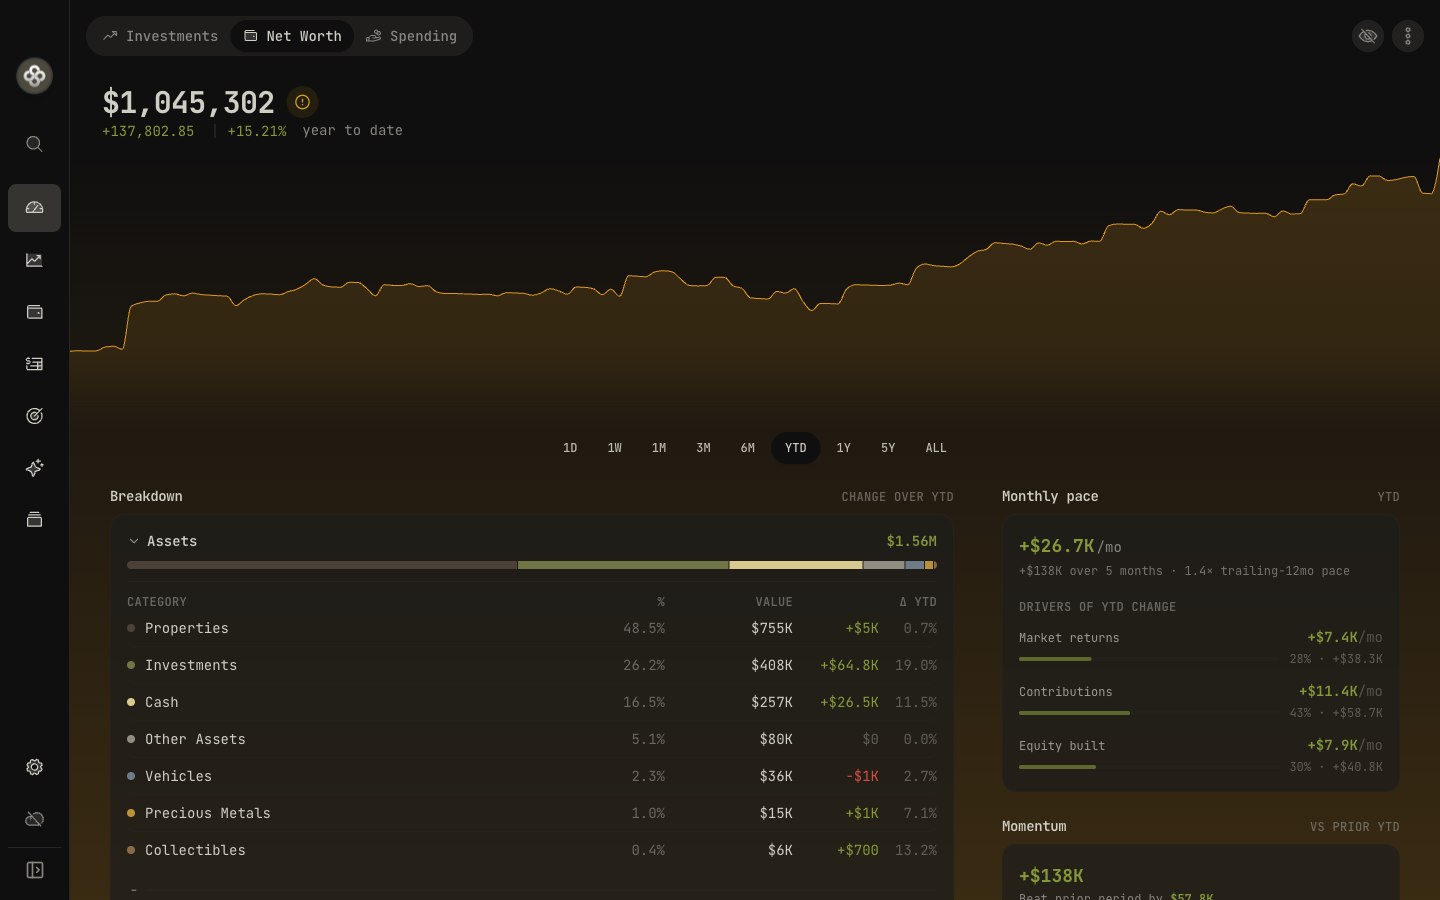
Switch to the Net Worth tab at the top of the home view for your full financial picture — not just investments, but property, vehicles, collectibles, precious metals, cash, and liabilities. Refreshed in 3.5, it adds:
- A richer breakdown of assets and liabilities, with expandable hierarchical categories and tap-to-expand detail drawers (mortgages net against the property they finance).
- Velocity and Momentum cards — how quickly your net worth is accelerating over the trailing year, and this period versus the equal window just before it.
- A stale-valuation warning for any asset you haven’t updated in 90+ days, with a direct link to fix it.
Spending
New in 3.5: track day-to-day cash flow alongside your investments. Categorize transactions, build budgets, and read narrative spending insights. See the Spending & Budgets guide.
Spending insights are on the Spending tab of Insights, next to Overview, Performance, and Income. The tab shows only when spending is turned on.
Goal Progress
If you’ve configured savings goals or a retirement target (Goals / Retirement Planning), this card shows progress relative to the deadline:
- 🟢 On track: projected to meet the goal on time.
- 🟡 At risk: projection is tight; small adjustments needed.
- 🔴 Off track: current pace won’t meet the deadline.
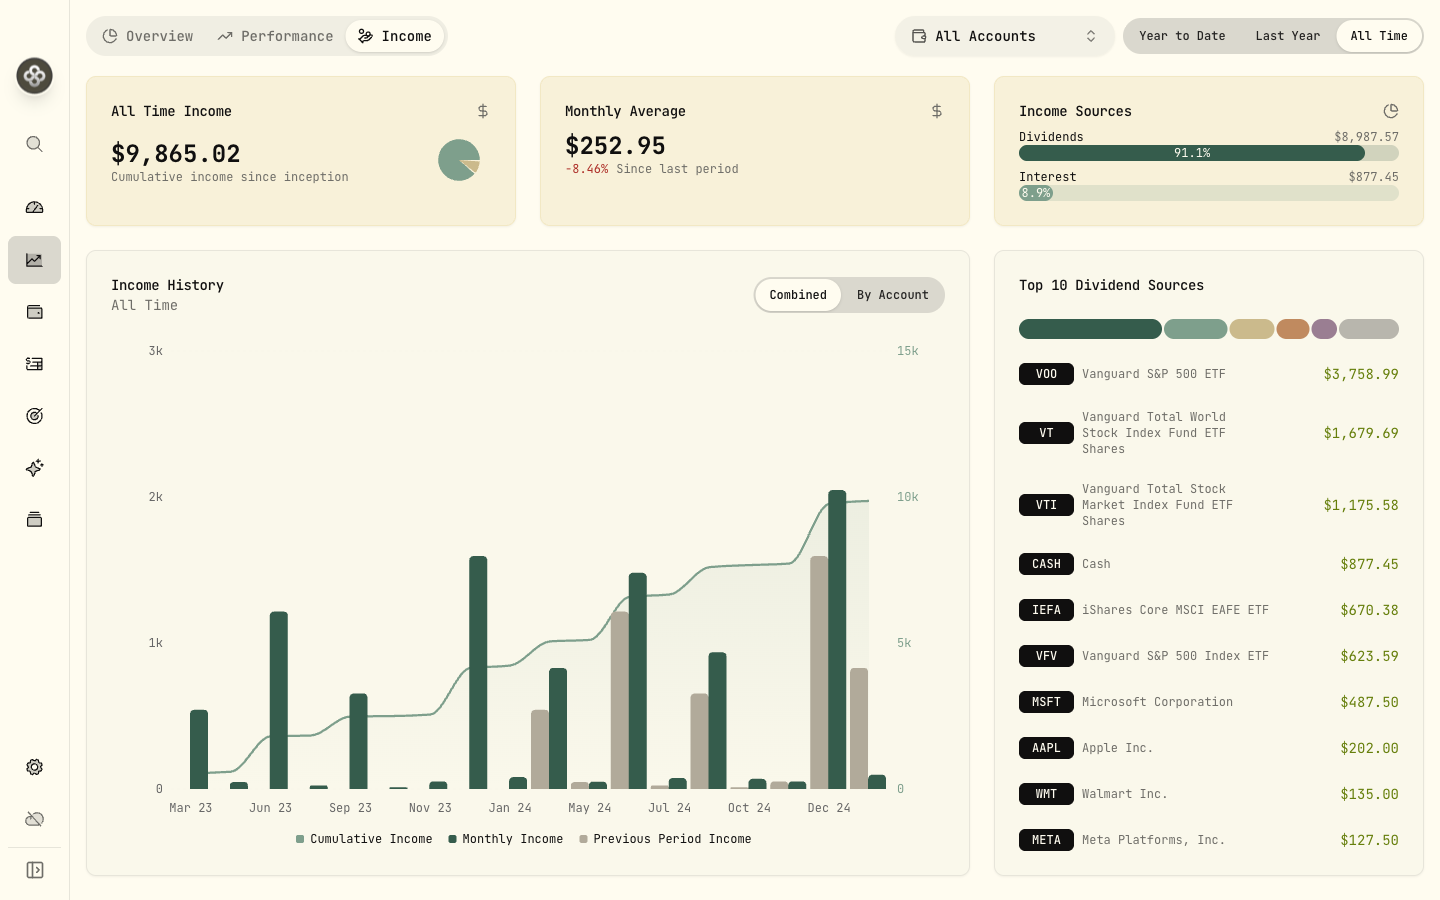
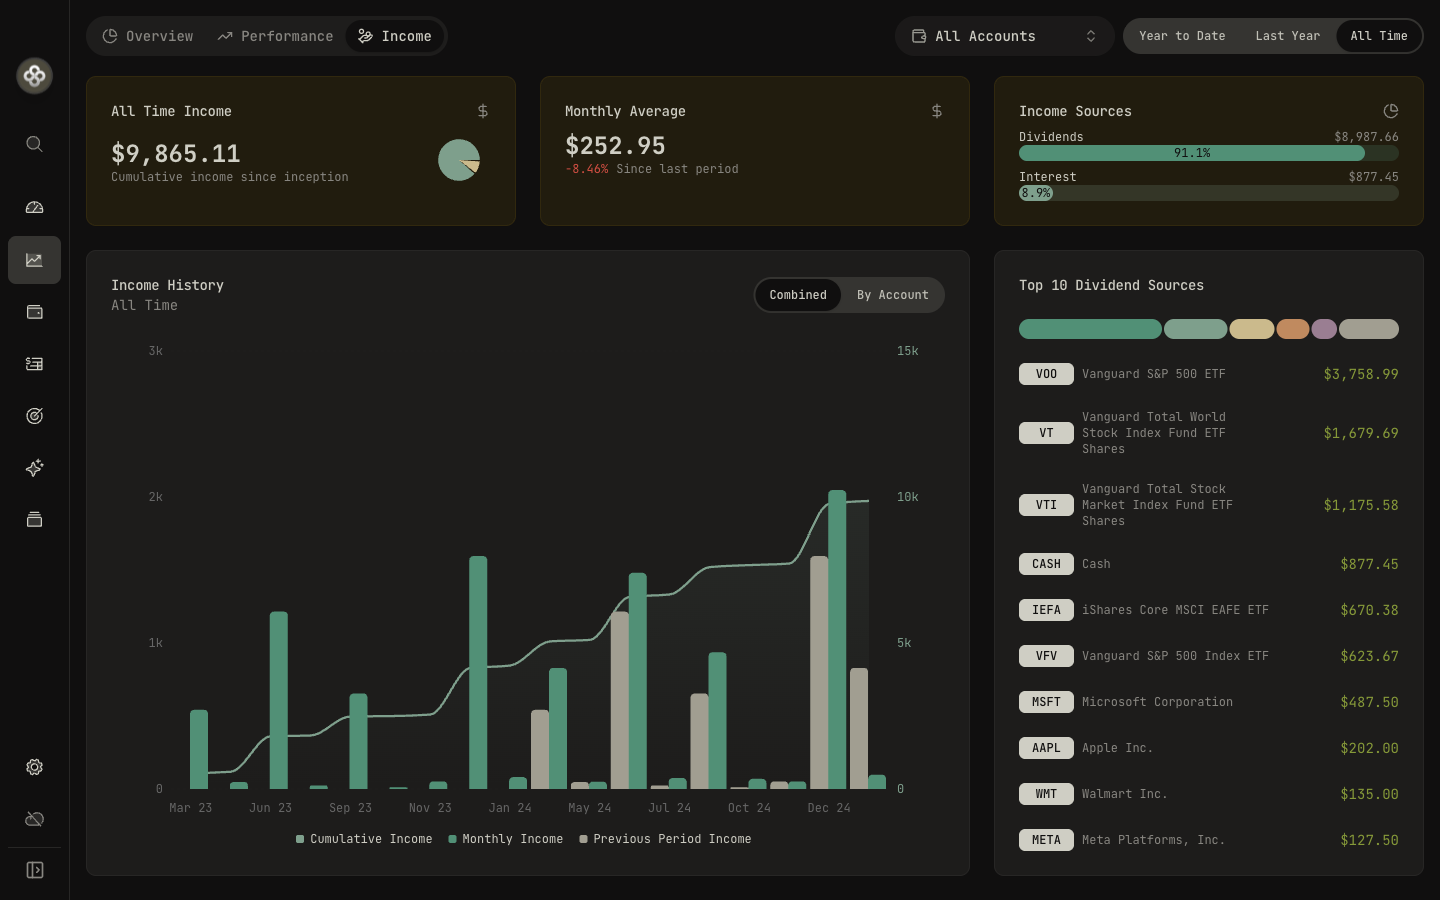
Income Dashboard
Tucked into the Income tab of Insights: dividend and interest income by period, with breakdowns by account and asset.
2 · Reading the performance numbers
The ”%” on the dashboard and account rows is MWR (money-weighted return) by default. It captures the impact of your timing decisions. The total portfolio also shows TWR when you drill into Performance.
If you’ve never thought about TWR vs. MWR, the Performance Metrics concept doc explains both with worked examples.
3 · Date range and base currency
- Date range (the period buttons under the chart) controls the chart and the change figures. It’s shared with the Net Worth and Spending tabs and with Insights’ Spending and Performance tabs.
- Base currency (Settings → General) controls what currency every total is converted to. Changing it doesn’t move any data; only the display conversion.
4 · When numbers look off
Start with the Health Center. It flags negative cash, stale quotes, and suspect spikes that often explain “why did this jump.” If you can’t find the cause, the FAQ walks through the common “why does my number look wrong” cases.