
Spending & Budgets
Track cash flow alongside your investments. Categorize transactions, build budgets, mark life events, and read narrative spending insights.
Spending & Budgets, introduced in 3.5, brings your day-to-day cash flow into Wealthfolio, right next to your investments. Categorize transactions automatically, set budgets that fit how you actually spend, tag life events, and read an insights page that explains where your money went.
Everything here is computed locally from activities already in your accounts. Nothing about your spending leaves your device.
Choosing spending accounts
Spending features work across the accounts you opt in. You can include multiple cash and credit-card accounts; their activities are aggregated into one cash-flow view.
- Charges (withdrawals, fees, interest) count as spending.
- Refunds / credits reduce spending.
- Credit-card payments move money between your own accounts, so they stay visible without double-counting as spending.
- Money moving from a cash account into an investing account is classified as Saving, kept in its own bucket rather than counted as spend.
Credit cards are fully supported. Track card spending, payments, and transfers in one place without inflating your totals.
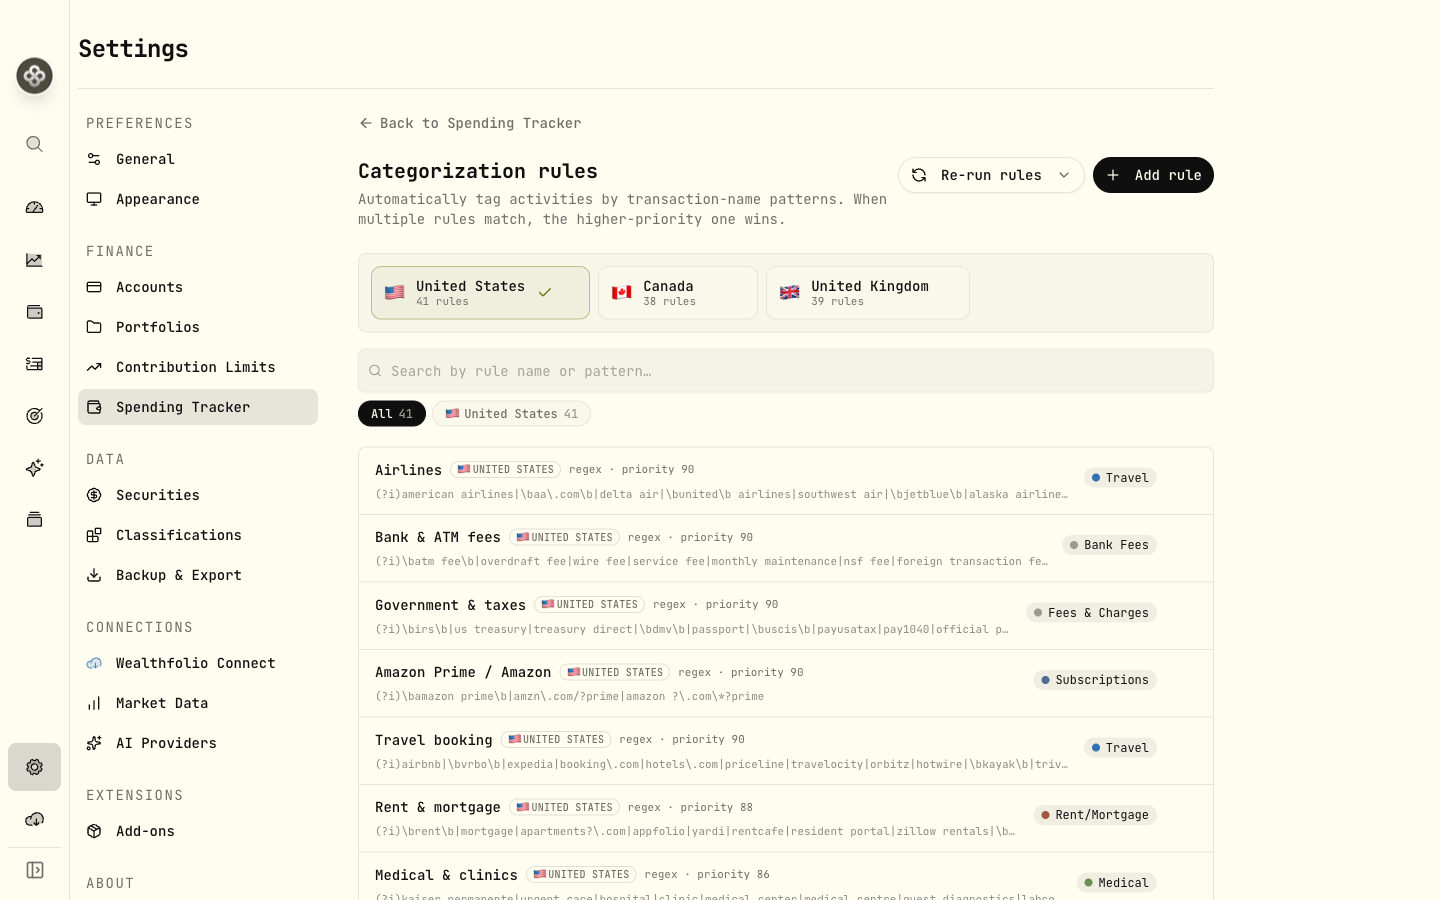
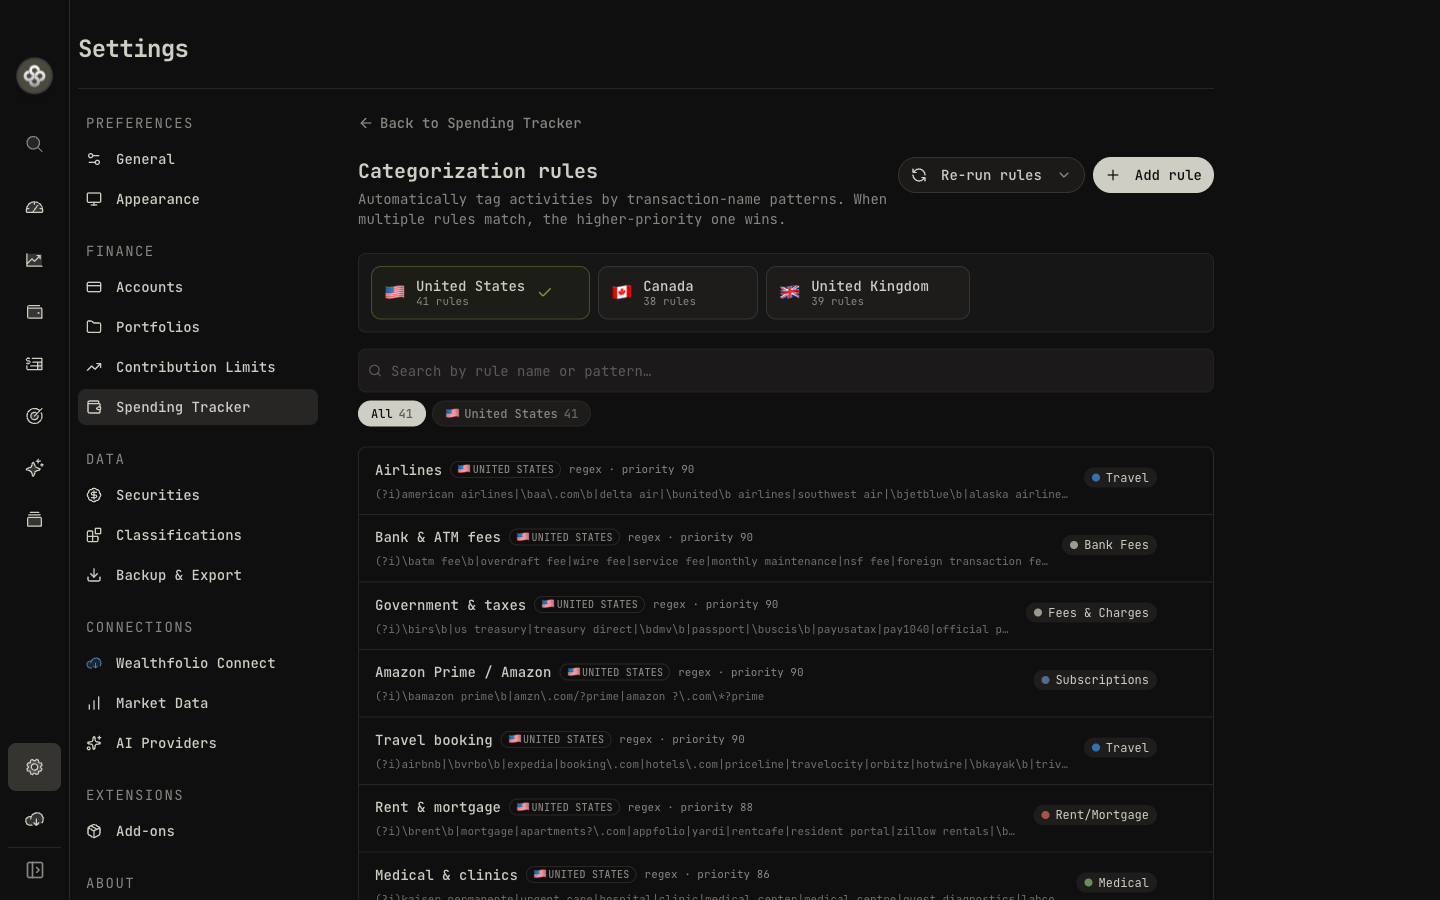
Categorizing transactions
Every transaction can be assigned to a category. You set up rules once, and Wealthfolio categorizes new transactions for you, with AI to help with whatever’s left.
Rules
A rule matches a transaction’s description and assigns a category. Each rule has:
| Setting | Options |
|---|---|
| Match type | contains, starts with, exact, or regex |
| Pattern | The text or expression to match against the description |
| Priority | Higher-priority rules win when several rules match |
| Scope | All accounts or a specific account |
| Taxonomy | Spending category, income source, or savings category |
You can start from rule presets (a library of common merchant/category rules), then tweak them. Rules can be re-run against all transactions or only the uncategorized ones, and Wealthfolio tracks how each assignment was made (rule, AI suggestion, or your own override).
AI suggestions
For transactions no rule covers, the AI assistant can propose categories. Review the proposals, accept the ones that look right, and optionally turn them into reusable rules. See the AI Assistant guide for setup.
A single transaction can hold more than one assignment. For example, it can be split across a spending category and a savings category, each with its own weight.
Budgets
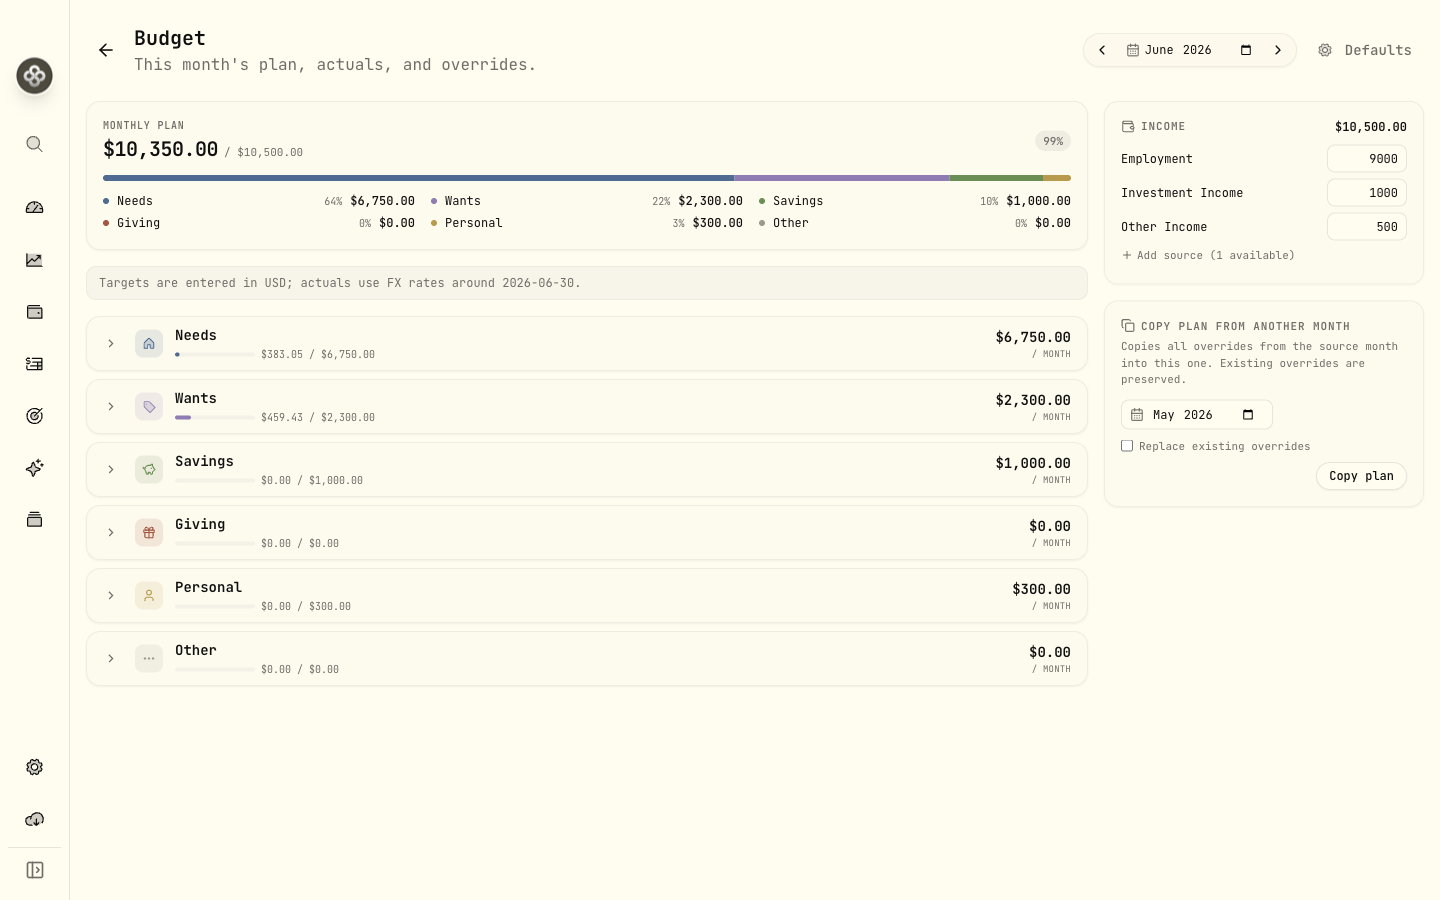
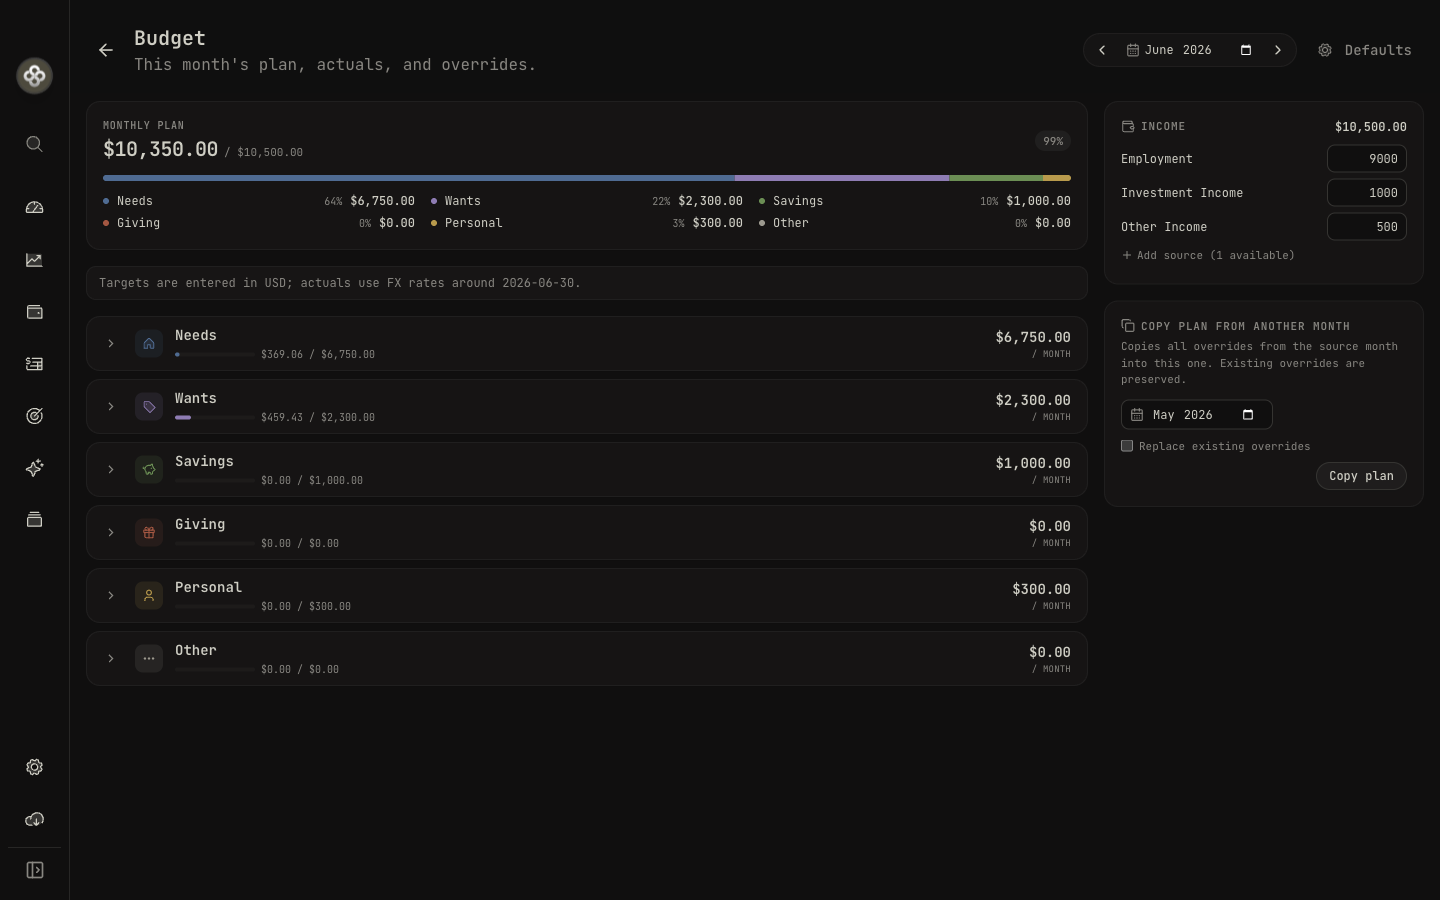
Open Budgets to plan a month and watch actuals fill in against your targets.
Groups and targets
Categories are organized into budget groups: Needs, Wants, Savings, Giving, Personal, and Other by default, each with its own colour and icon. You can budget at two levels:
- Category targets: a monthly target per category.
- Group buffer: an extra amount at the group level. The group total is the sum of its category targets plus its buffer.
Monthly periods, rollovers, and copy
- Budgets are scoped to a month (a
YYYY-MMperiod). Default targets apply to every month, and you can override any single month. - Rollover carries an unused or overspent balance forward into the next month. Enable it per category or per group.
- Copy last month clones a previous month’s plan into the current one in a click, so you don’t rebuild your budget every month.
The budget snapshot shows, per category and group: the target, the actual spend, the remaining
amount (target − actual), and an overspent flag when you’ve gone over.
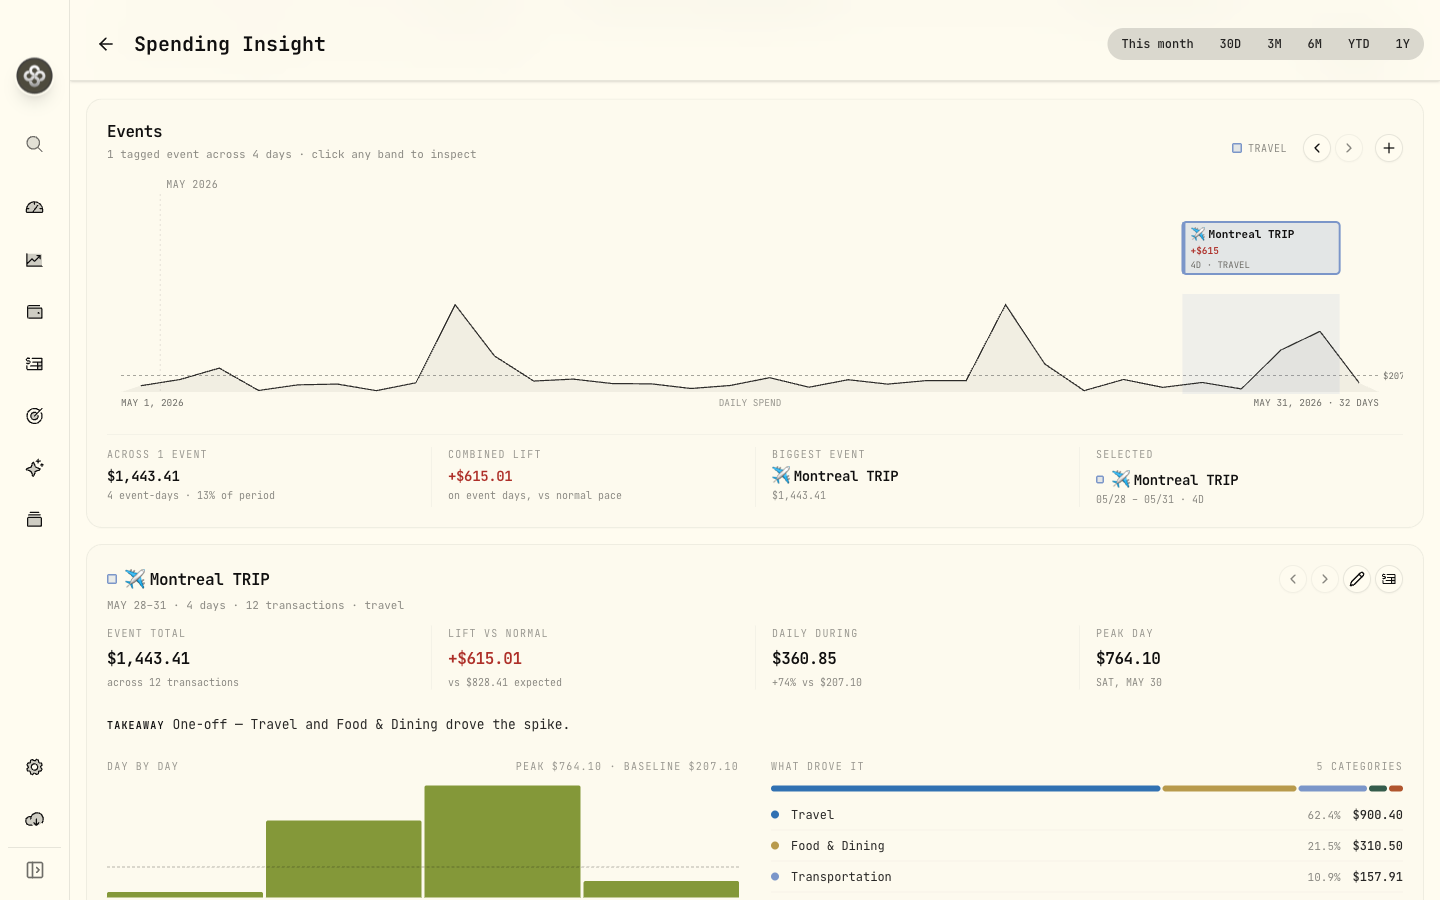
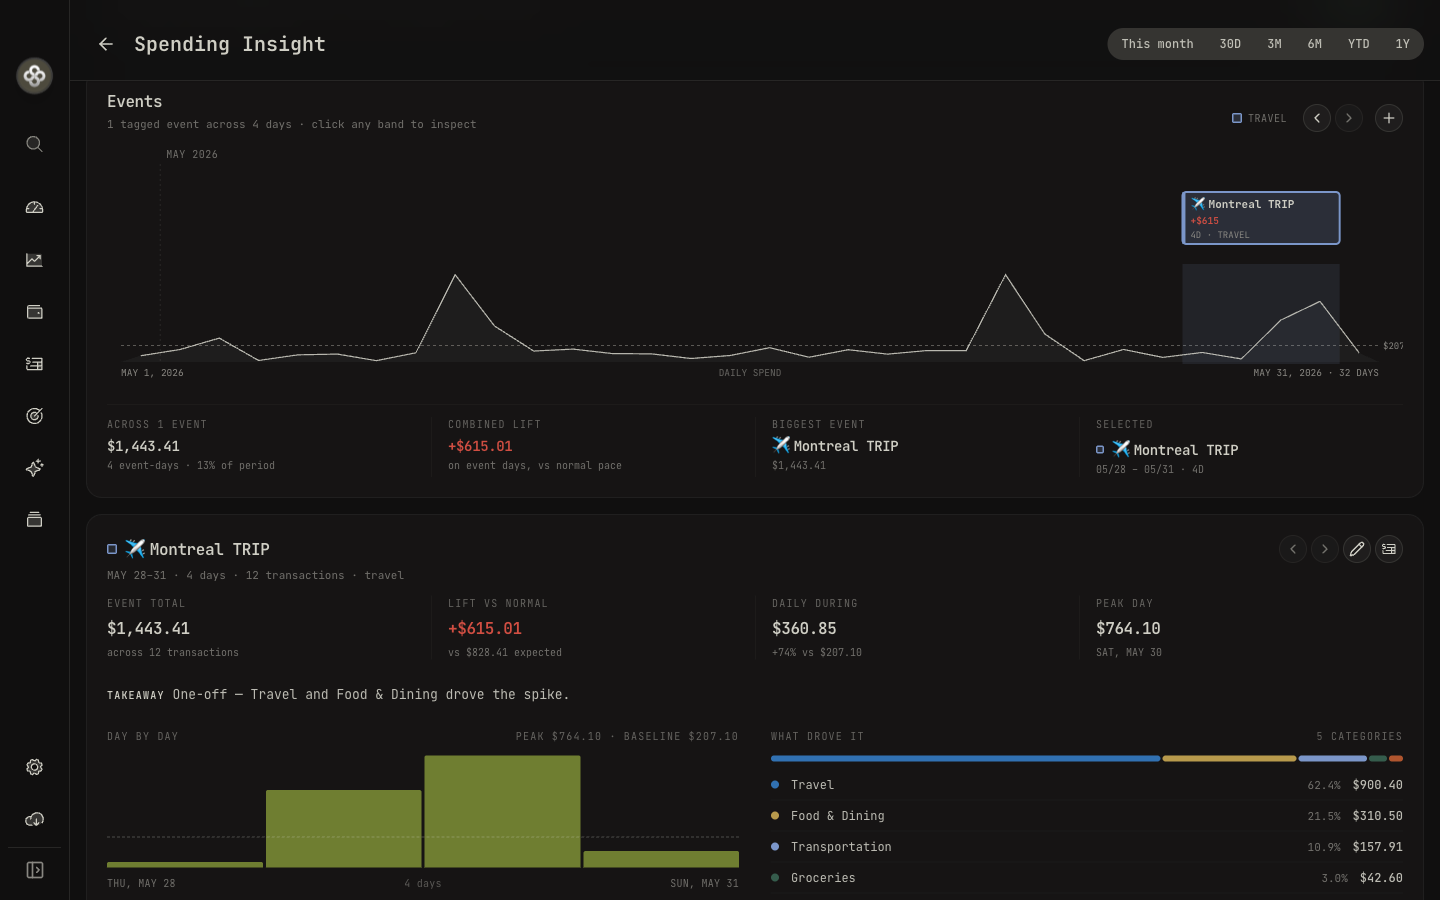
Life events
Mark events like a vacation, a wedding, or a home renovation on a timeline and tag the transactions that belong to them. Each event then totals up its true cost.
- Events are date-ranged (a start and end date) and colour-tagged. Several event types are seeded, and you can create your own.
- Tag any transaction to an event to include it in that event’s total.
- An event summary shows the total spent, the transaction count, a breakdown by category, and a day-by-day spending chart.
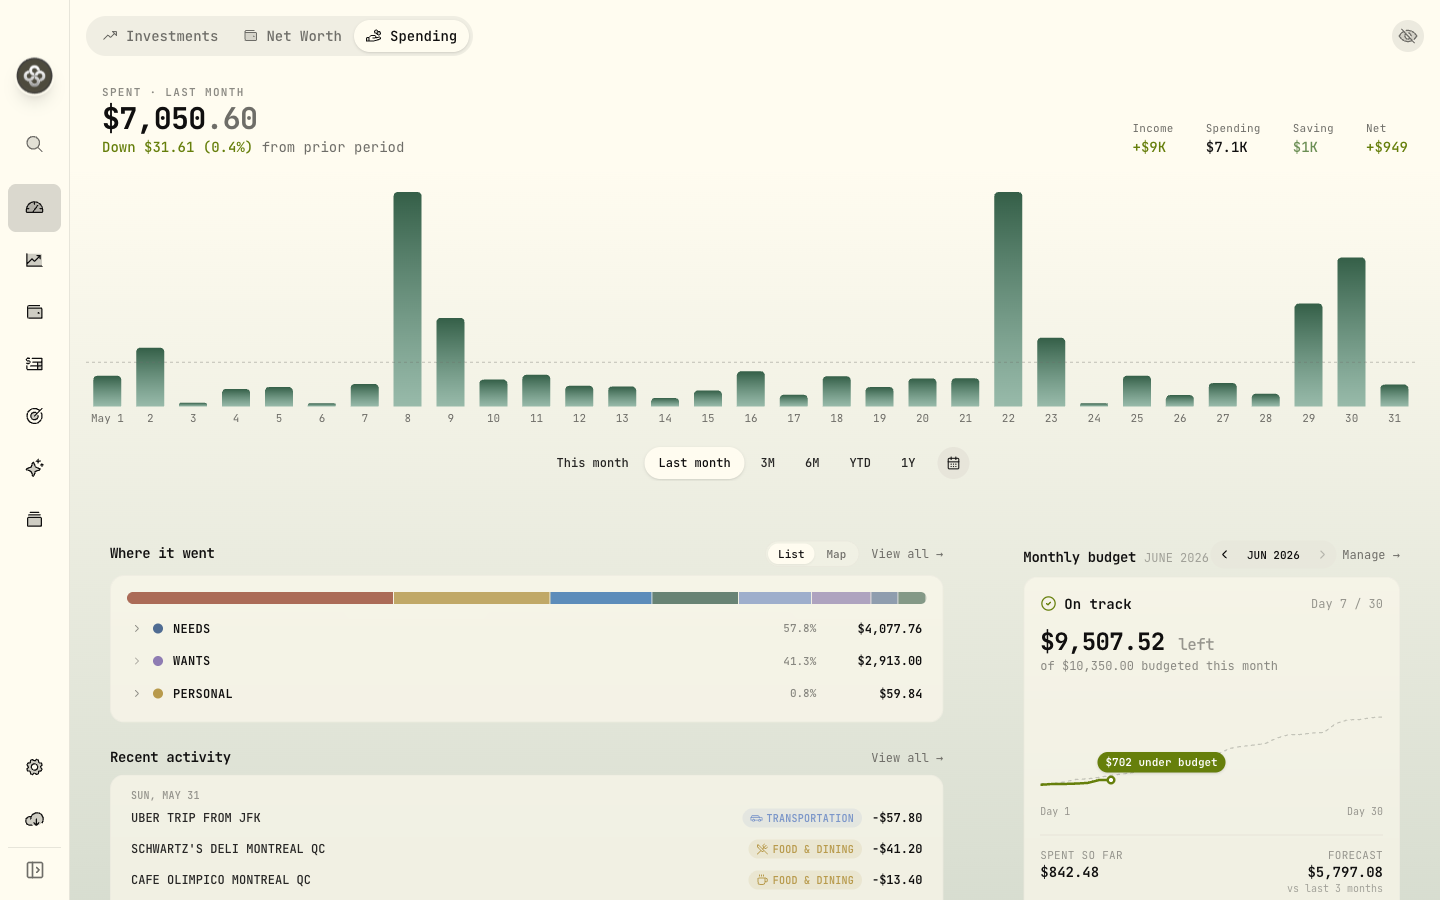
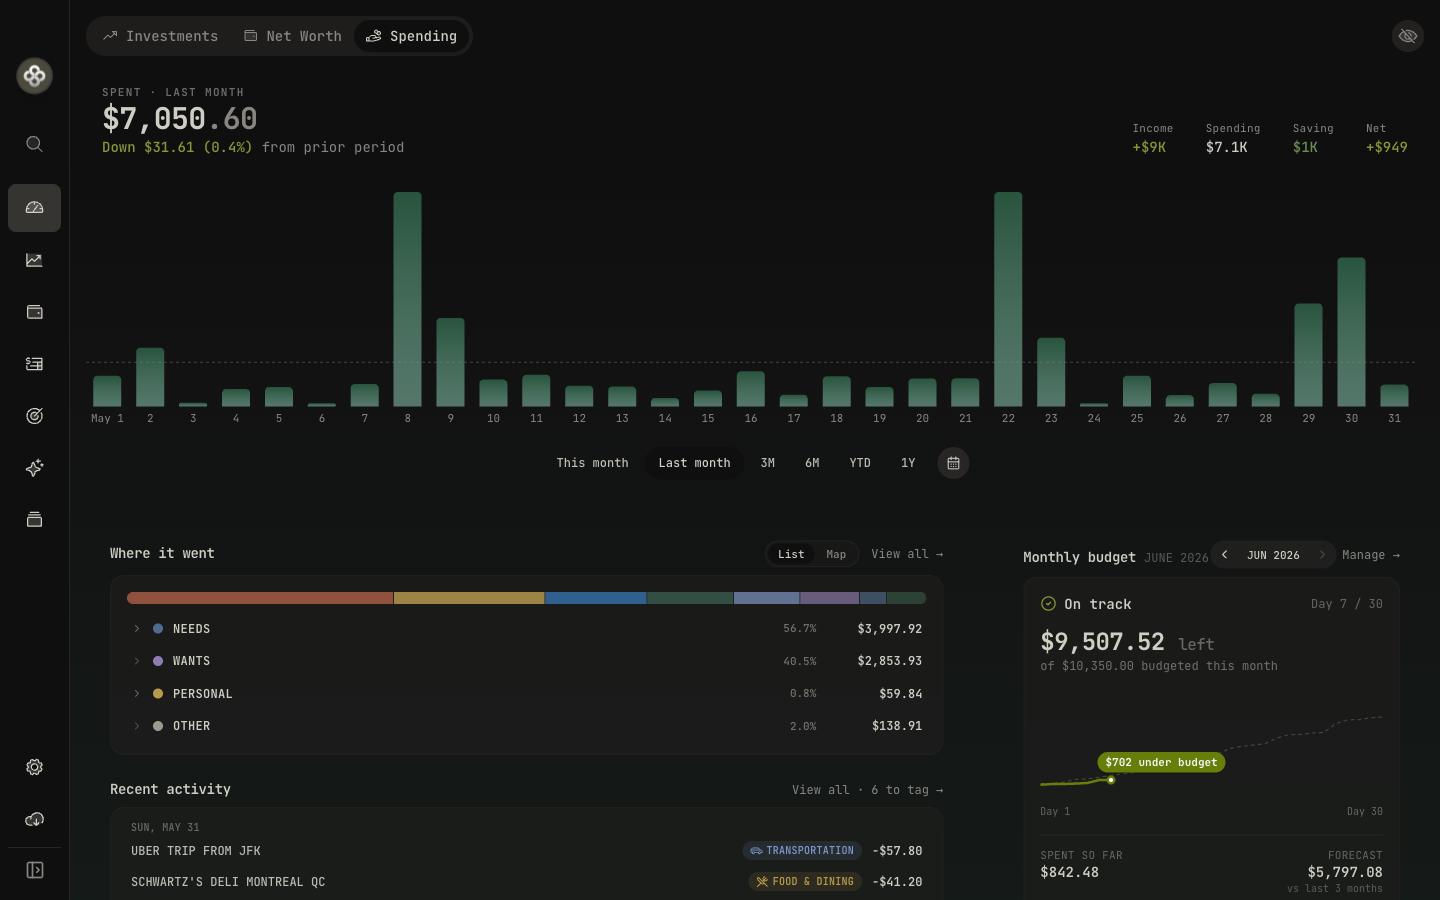
Spending insights
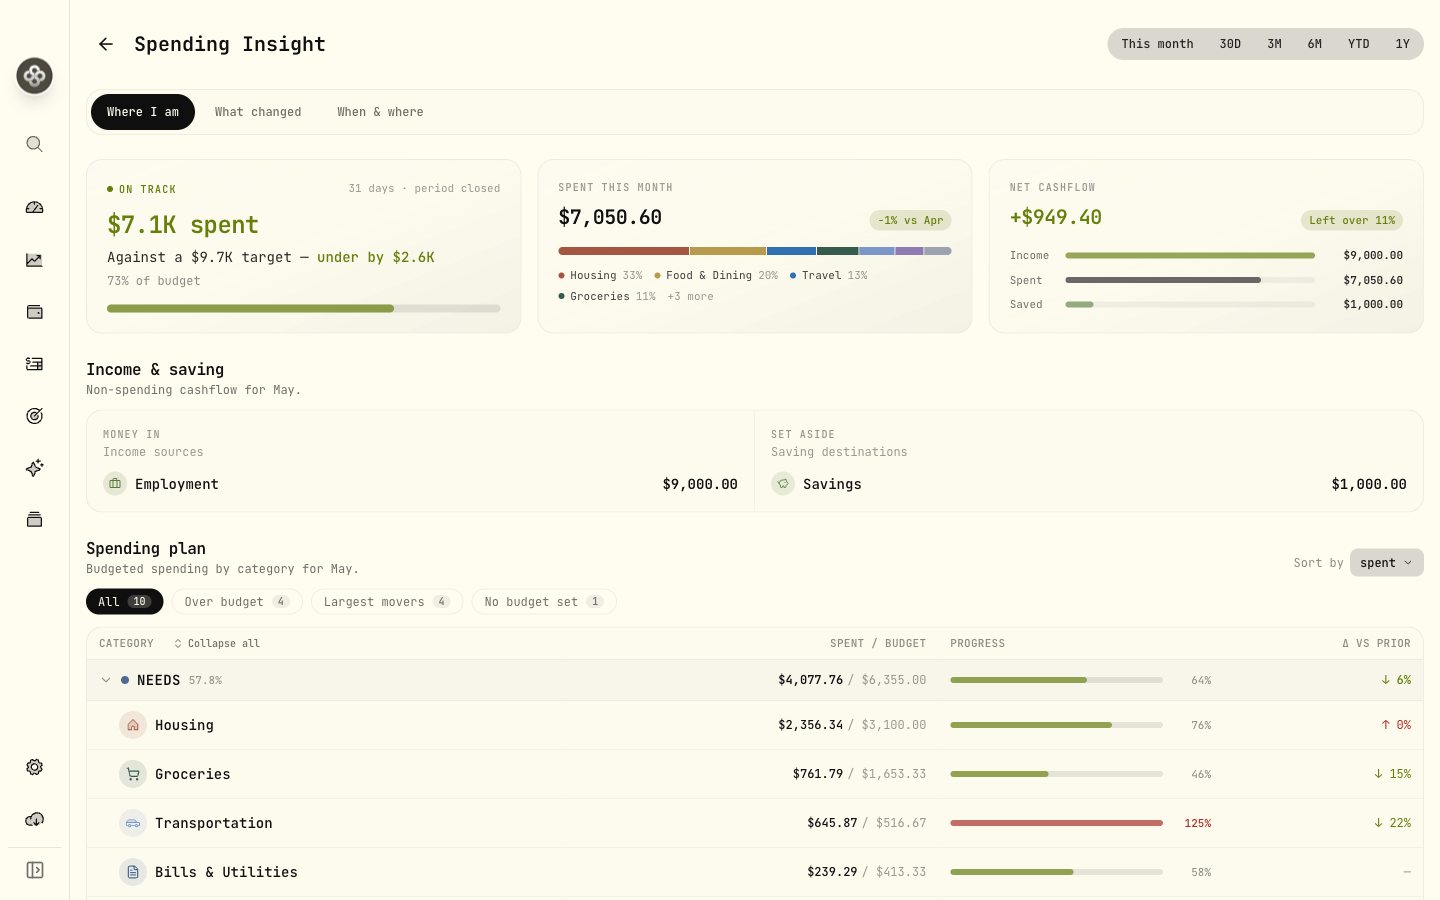
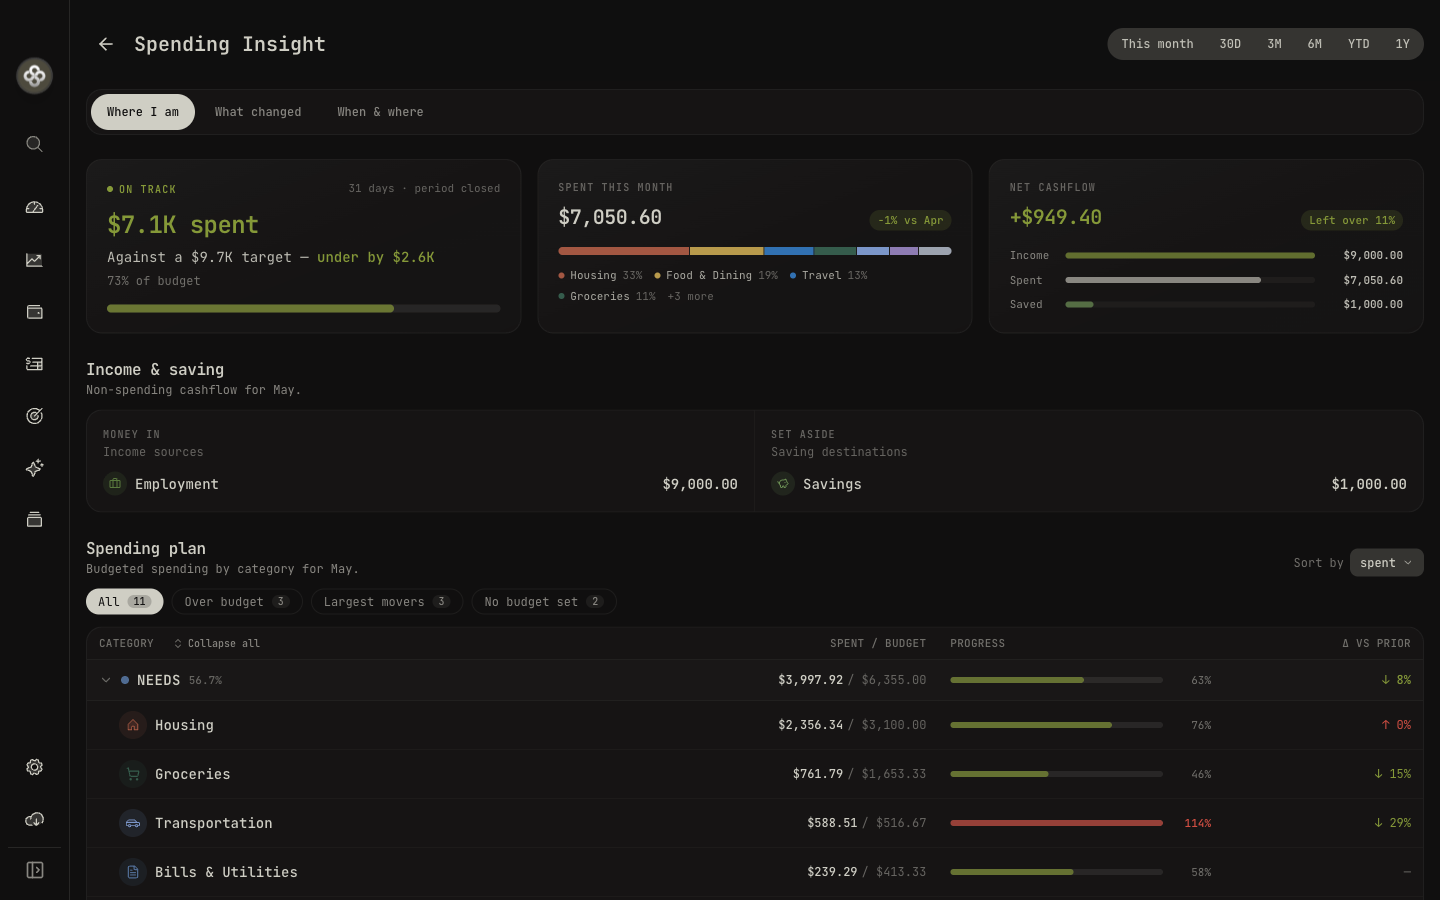
The Insights page reads like a short narrative in three stages.
1 · Where I am
- Pace: your trailing 7-day average daily spend, days elapsed and remaining, and projected
total for the period, compared against your budgeted pace. A health status reads
on track,approaching,over, orcashflow negative. - Spent this period: the period total with a change versus the previous period, plus the category breakdown and top movers.
- Net cash flow: income minus outflow minus saved, over time.
- Breakdown: a hierarchical category table of actual versus budget.
2 · What changed
- A plain-language headline (“You spent $X this period vs. $Y last period”) with the percentage change.
- Category movers: what is new, what ended, and which categories rose or fell the most, ranked by impact.
- Per-category sparklines and a table of the biggest increases and decreases.
3 · When & where
- A weekday × hour heatmap of the last several weeks; click any cell to see the transactions in that time slot.
- The events timeline, with each event expandable to its category breakdown and daily spend.
Multi-currency
Spending is reported in your base currency. When transactions span several currencies, amounts are FX-converted using rates from the period-end date, and the page notes this. Native (original- currency) totals remain available so nothing is hidden behind the conversion.
Drilling in
Almost every number is clickable:
- A category row opens a filtered transaction list (including its subcategories).
- A heatmap cell opens the transactions for that weekday and hour.
- An event opens its breakdown by category and daily spend.
Related
- Activities: how transactions get into Wealthfolio.
- AI Assistant: AI category suggestions and assisted import.
- Allocation Targets & Rebalancing: the other major 3.5 module.